A Data Center Team Stopped Re-Checking Every Revision. Here's What Happened.
Fourteen Revisions, One Record, No Rebuilding the Picture
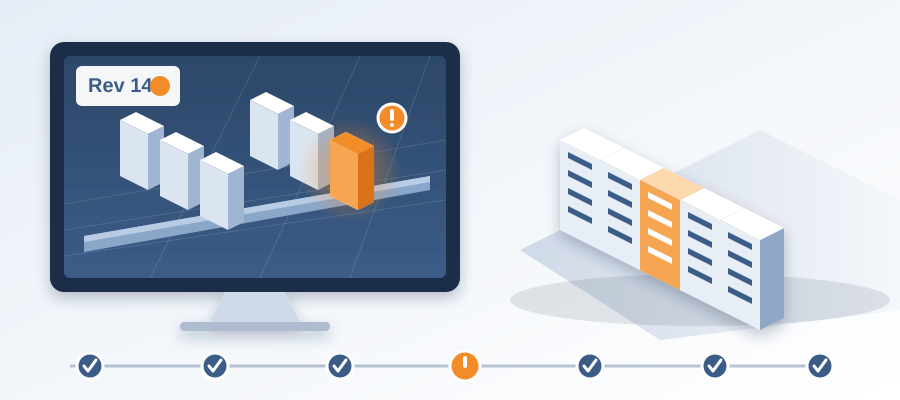
The number that matters here is fourteen. Fourteen model revisions landed during coordination. Racks moved, the electrical room grew, cooling loops got rerouted, and the containment layout changed twice in the last week.
On the old workflow, every one of those revisions kicked off the same routine. Somebody exported a fresh set of drawings, flipped between the old and the new, wrote up what looked different, and then chased down which version was current. Fourteen revisions meant fourteen passes. The team stopped doing that.

They kept one live record of the project inside Revit and Navisworks. The model was the source. Every publish became a versioned snapshot with its own files, author and milestone. Any two revisions compared element by element, grouped by structural, MEP, envelope and interior. Nobody re-keyed anything. Nobody wondered which file was the real one.

When the next revision came in, the team already knew what moved, who moved it and who had to act. That is the whole story. The picture stayed current because nobody had to make it current.
The client noticed the difference before anyone said a word about it. Questions got answers the same day, and the coordination meetings got shorter.
Why the Hours Are the Real Number in This Story
Hours are the cleanest way to explain what changed, because everyone in an AEC firm knows exactly where their hours go. Version checking is quiet work. It does not show up as a crisis. It shows up as a Thursday where three people are buried in model comparisons instead of solving clashes.
On a project like this, 11 hours a week can disappear into working out which model version is current. Somebody is comparing against the previous version. Somebody is cross-checking the markup. Somebody is reconciling the two. Then a revision lands and all of it restarts.


The hours came back because the comparing stopped being a human job. The model already held the geometry. Comparing two revisions took about 15 minutes instead of a 90-minute meeting, and the changed elements were listed by category. The comparison was not the point. The point was that nobody had to sit down and do it again.
Think about what those hours buy. It is time on the clashes that matter. It is another floor coordinated while the first is still moving. It is the difference between chasing the schedule and setting it.
Data center work is unforgiving on this front because the systems are dense and the revisions come late. A rack layout shift touches power, cooling, containment and cable tray at the same time. That is four sets of elements changed by one decision, which is exactly the kind of change that used to eat a week.
What Happens to the Job When Changes Stay Visible
Most coordination teams are not slow because they are bad at coordinating. They are slow because the model they started reviewing is not the model they finish reviewing. The gap between those two things is where the schedule bleeds.


When every publish shows its changes, the team does not need a catch-up sprint at the end. You are not redoing the last two weeks of work. You are reviewing changes that were already flagged as the design moved.
That changes the conversation with the client and the GC. Instead of explaining why the picture is a week old, you are answering questions about scope. Instead of asking for more time, you are acting on a change the morning after it happens. Early is a competitive position, and it is a defensible one when the record behind it came from the model.
This is how coordination becomes something you can defend. Every issue is pinned to an element. Every closure carries a screenshot, a tagged user and the model commit that fixed it. When the client asks why the electrical package changed, you point at the revision, not at a hunch.
It also changes what the team can show. A clash caught in the model costs about $50. The same clash found in the field costs $5,000 to $50,000. In a data center, where one unresolved clash can burn $15K to $50K a week in idle field labor, getting that early look is the job.


## The Pattern Shows Up Everywhere, Not Just Data Centers
If you run a firm in any sector, you already recognize the loop. The revision lands. The comparison gets redone. The meeting runs long because nobody is sure the picture is right. That uncertainty is where schedule quietly disappears.
Here is the honest framing. Coordination teams spend a large share of their week on mechanical work that has nothing to do with judgment. Exporting, flipping, pasting, reconciling. The judgment part, the part you hired them for, gets whatever time is left.
BidLight exists to take the mechanical part off the table. One live record of the project inside Revit and Navisworks, every export versioned, every change diffed element by element. Plans run from Basics at $260 per licence per year to Max at $590, with custom Enterprise pricing and unlimited projects on every plan. The software does the comparing. Your people do the thinking.
There is a second layer too. BidLight does done-for-you BIM work: execution plans, 4D sequencing, fabrication detailing and spooling. Some firms want the platform. Some want the platform and a team. Both are available.


If you remember only one thing, make it this. One live record of the project, inside Revit and Navisworks, with every change compared and every issue pinned to its element. Everything else in this article follows from that single idea.
What This Looks Like on Monday Morning
The first change you notice is not dramatic. It is that nobody is waiting on a comparison. The model gets published, the changes are listed, and every owner has their issues in the 6am digest before the morning meeting starts.
At the design review, you can answer on the spot. When the client asks what the rack change does to the electrical package, you open the comparison and show the elements. That moment is worth more than any deck you could have built over the weekend.
There is a second effect that is harder to see from outside. Your coordinators stop copying and pasting between files. The work gets more interesting, and people stay longer. Turnover is a cost problem whether or not anyone puts a number on it.


Then the accountability question comes up. The project view shows who is behind while there is still schedule to recover, and the Problem Solver Index shows resolution rates per person. You do not chase. The picture is there before the meeting starts.
The team in this story did not do anything heroic. They just stopped rebuilding the picture by hand and let the model carry it. Fourteen revisions, every one visible the day it landed, and a job that stayed ahead of the field.